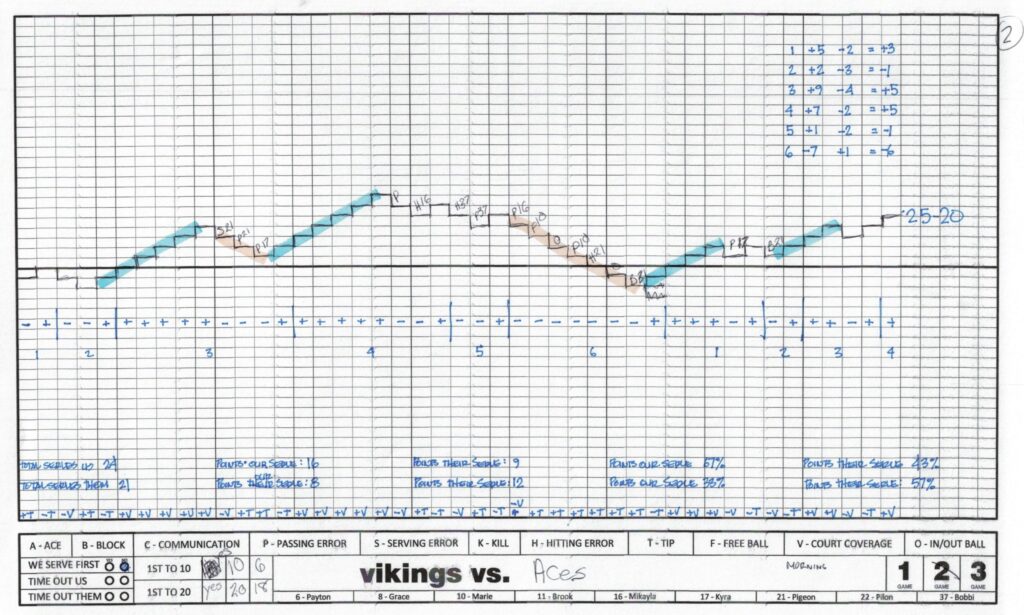
Above is an example of how to use the graph stat sheet found here https://docs.google.com/spreadsheets/d/1ZceB6d4_cuCallVp6qkW-BQyjuycWP4ywV-eyExcCKs/edit?usp=sharing
This coach is very familiar with using it, so he goes an extra few steps and adds a code for each point so he can reflect on the origin of strengths/ or opportunities.
If you are new to this, I suggest starting by just doing the trend line and marking the lines under it for rotations only. Then after the match go back and add up all the points +/- for each rotation. This will give you insight as to where the rotational weaknesses/strengths are. Perhaps you notice rotation 3 is particularly weak and from there you can start to assess the reasons why and make a better plan to adjust.
After you have gotten used to doing that perhaps add in your own coding methods to pe more precise with pinpointing the root causes of trends.


